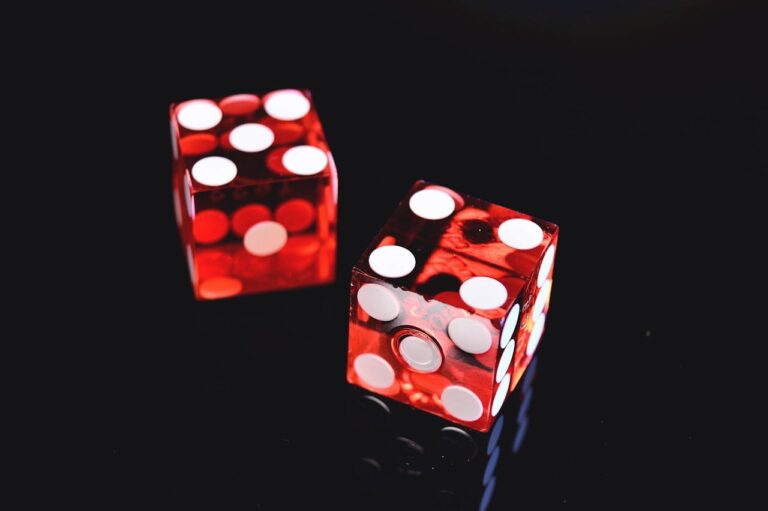
When you roll a die, you engage in one of the most accessible forms of probability math. Whether you’re slinging spells in a Dungeons & Dragons campaign or helping 6th graders learn about ratios, dice offer a tactile and satisfying way to explore math concepts.
In this post, we’ll break down the probability behind the most common dice—D4 through D20—and explain how understanding these numbers can help you with game design, classroom instruction, or just sharpening your own analytical skills. And yes, there’s a free printable PDF below so you can take this knowledge offline!
What Is Probability (and Why Does It Matter)?
Probability is the branch of math concerned with chance. It helps us quantify how likely an event is to occur.
In the case of dice, probability answers questions like:
What are the chances of rolling a 6 on a D6?
How likely am I to roll a number greater than 3 on a D8?
What are the odds of two dice summing to 7?
Knowing this isn’t just useful for math teachers—it’s also essential for:
🎲 Tabletop roleplaying game (RPG) players and developers
📊 Statisticians running simulations
🎮 Game designers creating fair experiences
🧠 Educators teaching real-world math concepts
The Basic Probability Formula
For any die, assuming it’s fair, the formula for the probability of any specific face is:
P(outcome) = 1 ÷ number of sideP(rolling a 4) = 1 ÷ 6 = 0.166... or ~16.67Common Dice and Their Probabilities
Here’s a breakdown of commonly used dice in games, their faces, and the associated probabilities:
| Die | Sides | Probability of Any Single Face |
|---|---|---|
| D4 | 4 | 1/4 = 25% |
| D6 | 6 | 1/6 ≈ 16.67% |
| D8 | 8 | 1/8 = 12.5% |
| D10 | 10 | 1/10 = 10% |
| D12 | 12 | 1/12 ≈ 8.33% |
| D20 | 20 | 1/20 = 5% |
Download the full table of probabilities for each face on a variety of dice:
Use Case #1: Teaching Probability in the Classroom
Teachers often use D6 dice to teach basic probability, but the principles extend easily to other dice. For example:
Example Activity (Grades 4–6):
Have students roll a D10 fifty times and record how many times each number appears. Then have them calculate:
The experimental probability of each number
How it compares to the expected 10% for each
You can use tools like FreeOnlineDiceRoller.com to automate rolling or support digital classrooms.
📎 Internal Resource: Check out our Probability Exercises for Students for ready-made activities and more printables.
Use Case #2: Balancing Game Mechanics
If you’re designing a game—whether a board game, card game, or RPG—understanding dice probability can make or break the experience.
Imagine a spell that succeeds on a roll of 15–20 on a D20. That’s:
P(success) = 6/20 = 30%
Now compare that to a spell that succeeds on 11–20:
P(success) = 10/20 = 50%
By adjusting the “success range,” you directly control the difficulty and fairness of in-game events. Over time, players sense when a game feels too lucky or too deterministic—math is the secret behind that balance.
Quick Tip: Combine Dice for Fun Probabilities
Rolling multiple dice and adding their results introduces compound probability. For example:
The sum of two D6s is most likely to be 7.
The distribution forms a bell curve:
There’s only one way to roll a 2 (1+1)
But six ways to roll a 7 (1+6, 2+5, 3+4, etc.)
This is critical in games like Monopoly or Risk, where movement depends on sums of dice.
Recommended Tools & Products
If you’re exploring dice and probability further, these tools can enhance your experience:
🎲 Polyhedral Dice Set (Amazon) – Great for classrooms or gaming.
📊 Graph Paper Notebooks (Amazon) – Ideal for tracking outcomes.
🧠 Probability and Statistics Workbooks (Amazon) – Supplement classroom exercises with structured problems.
Bonus: Visualizing Dice Distributions
Want to take it a step further?
Create a histogram or pie chart from your roll data to show the distribution of outcomes.
Try this exercise:
Roll a D12 100 times using FreeOnlineDiceRoller.com
Tally the frequencies in a spreadsheet
Use Google Sheets or Excel to create a bar chart
Discuss why some numbers may appear more than others
Conclusion
Dice aren’t just for games—they’re miniature math machines. Whether you’re a student learning ratios, a teacher planning probability lessons, or a game designer balancing mechanics, understanding how dice probability works is critical.
Be sure to:
Bookmark FreeOnlineDiceRoller.com
Download our Probability Chart PDF
Explore more classroom and game resources on our Resources Page
🎲 Happy rolling—and may the odds be ever in your favor.

